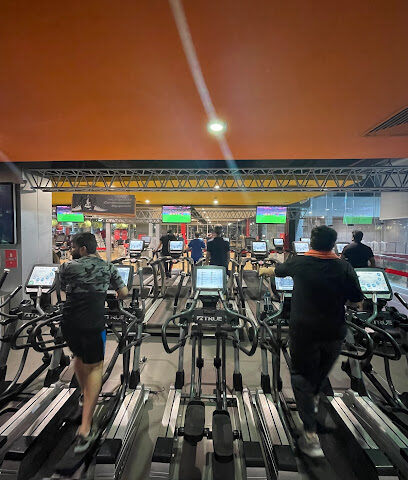
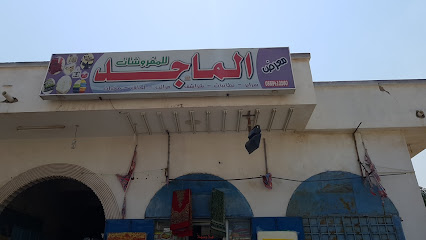
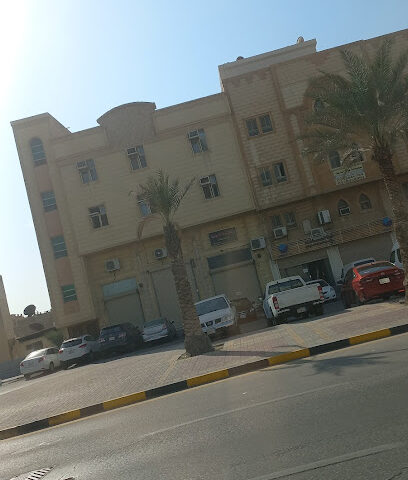
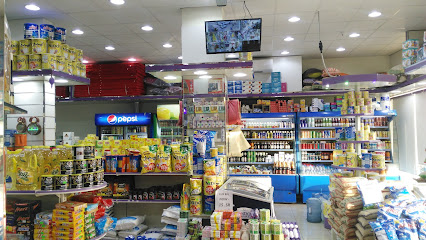
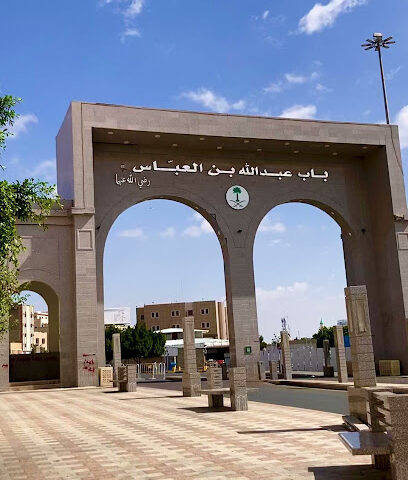
Monitoring
Real-time monitoring represents the activity of all clients accessing Internet through ISA Server. You can view information on the address of each client, the user name, the number of connections, the remaining traffic counter and the names of the Shaping and Quota Rules applied. The current and average values of the incoming, outgoing, total, and cached traffic speed and the corresponding graphs are also available for each object.
  |
Real sample of real-time monitoring (click to enlarge figure) |
You can set up the monitoring options using the context menu of the Monitoring:
- Using the Freeze option, you can temporarily pause monitoring (you can also enable this option by selecting the button
on the toolbar of the ISA Management console)
- Select Connection Details (you can also enable this option using the button
on the toolbar) to view additional information for each client
- The Bandwidth Units command enables you to select the preferred speed display format: in bytes per second, kilobits per second or kilobytes per second
- Select Show Percentage to additionally enable display of the bandwidth used by each connection or client in percent of the total bandwidth
- The Enable RDNS for Destinations item turns on reverse resolution of destination IP addresses to DNS names
- Use the Show Full Names command to enable displaying of full user names instead of account names (based on AD data)
- Select Exclude Cached Traffic from In if you want traffic of cached web content to not be considered when calculating of displayed incoming speed
- Select Smoothed Graphs if you prefer smoothed (antialiased) rendering of graphs
Having selected Connection Details and some user (or a group of users) in the clients window (top), you can see the details of each of this user's connections in the connections window (bottom). This data includes:
- Client Address: the IP address of the client
- Client Computer: the name of the client host
- User Name: the user name
- Client Type: the type of client (Web Proxy, SecureNAT or Firewall)
- Transport: the transport protocol used (TCP or UDP)
- Direction: the direction of the connection (inbound or outbound)
- State: the state of the connection
- Auth Type: the authentication type
- Method: the request method used (web requests only)
- Destination Name: the name of the destination host
- Destination Address: the IP address of the destination host
- Inbound Port: the local inbound port (only for incoming connections if a static port is used)
- Destination Port: the destination port
- Protocol: the connection protocol*
- URL Path: the URL path**
- Last In Speed: the current rate of the incoming dataflow
- Avg In Speed: the average rate of the incoming dataflow
- Last Out Speed: the current rate of the outgoing dataflow
- Avg Out Speed: the average rate of the outgoing dataflow
- Last Total Speed: the current total dataflow rate
- Avg Total Speed: the average total dataflow rate
- Sent Bytes: the amount of data sent by the current connection
- Received Bytes: the amount of data received by the current connection
- Content Type: the MIME content type
- Content Length: the expected content length
- Cache Info: information if the cache is used or not
- Status/Error Code: the status/error code
- Created: the time when the connection was initiated
- Shaping Rule: the shaping rule used
* The protocol names are defined by Protocol Definitions in Policy Elements.
** The parts of URL's that follow '?' or '#' are truncated, as well as strings longer than 255 characters.
Active objects are displayed in the monitoring window in black text color. After all connections of an object have been closed, the object is first displayed in grey and then removed from the monitoring window at all until it resumes activity.
From all parameters available for monitoring you can choose just those that you want to view at a moment - columns in the monitoring window can be easily hidden.
By right-clicking the clients or connections you can copy to clipboard some information about selected clients or connections.
 |
Note. Monitoring graphs are scaled to the highest speed rate for the period and can be used just to appraise the speed dynamics of a client or a connection. Generally it does not make sense to compare graphs by height, as they may have different scale. |
You can filter displayed connections by configuring conditions in a way similar to the one used in ISA Logging.
This functionality can be invoked by clicking on Filter... button in toolbar, or via menu.
You can save your filter configurations in preset filters, and then quickly load them when needed.
See also
Quick Start
© BNTC Software. All rights reserved.